
BEFORE TESTING
Determine specific testing locations. They will be located in Berkeley (Location 1), Red Bank (Location 2), and Bay Head (Location 3), all locations along the coast of New Jersey, but precise locations still need to be determined. Also, confirm ideal sampling dates and times, as they need to be consistent throughout the process. More specifically testing will be completed in three sets of four-week intervals, once in the summer once in the fall, and once in the winter. Testing at the locations will be spread out throughout the day.
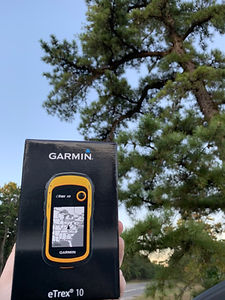
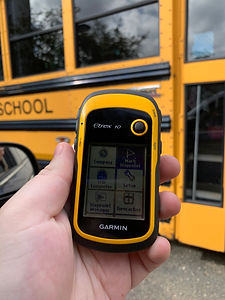
Purchase the Global Positioning System that will be used in this project, a GARMIN eTrex 10 Consult the GPS manual for the device used for sampling and learn how to turn the WAAS correction on and off, as this is crucial for testing to occur.
TESTING PROCEDURE
Once at the location, record the time and date. Also, record the air temperature, wind speed, and overall weather conditions using data from the National Weather Service website, https://www.weather.gov/
Turn on the GPS receiver with WAAS capability turned on, and record the location data, which includes latitude, longitude, and altitude.
Immediately after taking those readings, turn off the WAAS on the GPS and measure and record the location data again.
Repeat steps 3 and four for a total of three times.
Directly after each GPS reading, go to the Space Environment Center website, http://www.swpc.noaa.gov/products/planetary-k-index, and record the value of the planetary K-index (Kp) at the time of the measurement. Specifically, at the upper right hand corner of the page, the website will indicate if there are currently any geomagnetic storms taking place. If a storm is taking place at the time, a green box with a “G” in it will appear. Also, if a storm is occurring, the website will list the scale of the storm, which indicates how it might affect power systems, spacecraft operations, and other systems. The scale goes from G1 to G5 with G1 being the weakest. Be sure to record if a storm is occurring, as well as the scale.
Record Real-Time Solar Wind (RTSW) Temperature and Speed. This will be used as an aspect for correlation, as well as to create the prediction model. Data will be collected from the National Oceanic and Atmospheric Administration (NOAA) Space Weather Prediction website, https://www.swpc.noaa.gov/products/real-time-solar-wind. Temperature will be recorded in degrees Kelvin (Kº) and solar wind speed will be recorded in kilometers per second (km/s).
Collect the GOES Proton Flux value at the time of the measurement. The measurements range from 10-2 particles • cm-2 • s-1 • sr-1 to 104 particles • cm-2 • s-1 • sr-1. Measurements will be collected utilizing the GOES-16 thresholds of ≥10, ≥50, ≥100 directly following each reading. This is an indicator of solar proton events, which are directly related to geomagnetic storms. This value can be obtained from the Space Weather Prediction Center website, https://wwhttps://www.swpc.noaa.gov/products/goes-proton-flux
Collect the GOES X-Ray Flux value at the time of the measurement. The measurements range from 10-9 Watts • m-2 to 10-2 Watts • m-2. Measurements will be collected utilizing the GOES-16 Long and Short wavelengths. This is an indicator of solar activity, including but not limited to Coronal Mass Ejections and Solar Flares. This value can be obtained from the Space Weather Prediction Center website, https://www.swpGOESX-rayFluxc.noaa.gov/products/goes-x-ray-flux.
Repeat Steps 1 to 8 under the ‘Testing’ section at every location every day for four weeks at the same time of day during the summer and the fall.
TESTING LOCATIONS
The three testing locations for this project are: Berkeley (Location 1), Red Bank (Location 2), Bay Head (Location 3). These locations were specifically chosen for their differing characteristics and the relationship of their location to one another.
BERKELEY (LOCATION 1)
This is your other projects section. It’s a great place to update your readers about previous projects you’ve done, or the ones you are working on. Add photos, illustrations and videos. Proud about your work? Don’t keep it to yourself! Let users know about it, and add a link to the original project or write-up.
RED BANK (LOCATION 2)
This is your other projects section. It’s a great place to update your readers about previous projects you’ve done, or the ones you are working on. Add photos, illustrations and videos. Proud about your work? Don’t keep it to yourself! Let users know about it, and add a link to the original project or write-up.
BAY HEAD (LOCATION 3)
This is your other projects section. It’s a great place to update your readers about previous projects you’ve done, or the ones you are working on. Add photos, illustrations and videos. Proud about your work? Don’t keep it to yourself! Let users know about it, and add a link to the original project or write-up.

SURVEY
Create a survey on Google Forms. Include questions to determine participants prior knowledge of GPS, geomagnetic storms, and WAAS (Figure 11).
Next, give participants an excerpt to read to learn about geomagnetic storms.
Finally, give follow up questions to ascertain how people’s opinions change before and after being educated on the possible effects of geomagnetic storms.
Include questions about demographic information, including sex, age, education level, and political party. This is the same demographic information collected by Pew Research Center in their surveys.
Confirm that all questions are unbiased, and then send out surveys to a variety of people to collect responses. 500 responses is the ideal sample size (n=500).
Run Kruskal- Wallis statistics, which are similar to ANOVAs, to determine statistical differences between each of the varying demographic groups being analyzed. If the tests show to be significant, a post-hoc Tukey test should be run to determine where the difference lies. Use a p-value of 0.05 for all of the statistical analyses.
STATISTICAL ANALYSIS
After all of the data has been collected, the error signal for each measurement should be calculated. The error signal is calculated by taking the difference between each pair of readings- the altitudes, longitudes, and latitudes from each testing session.
Run regression statistics between the GPS error signals calculated and geomagnetic storm activity to determine whether a greater amount of error indicates geomagnetic storms. Correlation can be determined overall, at locations, in different seasons, and based on certain weather conditions, such as air temperature and wind speed.
Student’s t-tests and ANOVAs will also be used to determine if there is a difference between the amount of error in GPS signals based on underlying factors such as: time of year, locations, and weather conditions. Testing in the summer and fall is crucial to compare because of the Earth’s differing position in relation to the sun during these periods.
Create graphical displays of the data in order to create a representation of the statistical analyses completed in earlier steps. Specifically, correlation graphs can be created to represent the altitude, longitudes and latitudes at each location based on each of the aforementioned variables being considered. Bar graphs can be created to display the difference in geomagnetic activity based on certain variable conditions.
Determine the most effective prediction model for tracking future geomagnetic storms based on data collected during this research. This model will include weather, solar activity, and GPS errors.